aeciopires/go-sse
A web application for testing Server-Sent Events (SSE) protocol using Golang
5.3K
aeciopires/go-sse repository overview
go-sse
A lightweight web application written in Go for testing and demonstrating the Server-Sent Events (SSE) protocol. It comes instrumented with Prometheus metrics, structured JSON logs and OpenTelemetry traces.
- Source code: https://github.com/aeciopires/go-sse
- Helm chart (Kubernetes, Helm 4): https://github.com/aeciopires/go-sse/tree/main/helm-chart
- Documentation (beginner-friendly): https://github.com/aeciopires/go-sse/tree/main/docs
- Changelog: https://github.com/aeciopires/go-sse/blob/main/app/CHANGELOG.md
- License: GPL-3.0
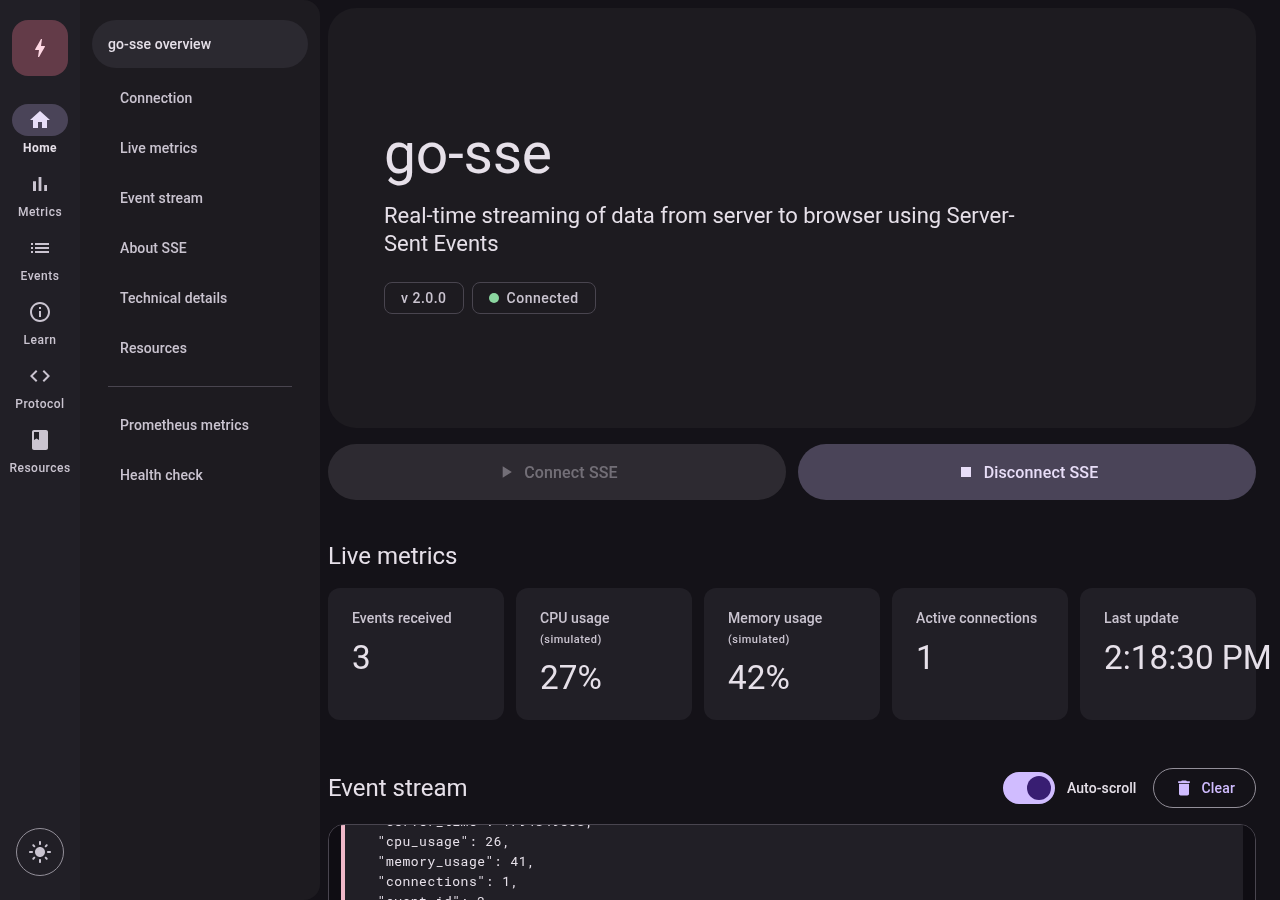
Table of contents
- What is SSE?
- Quick start
- Configuration
- Endpoints
- Features
- Full observability stack with Docker Compose
- Kubernetes
- Useful flags
- Contributing
- Maintainer
What is SSE?
Server-Sent Events is a simple, one-way protocol that streams real-time text data from a server to a client over a single long-lived HTTP connection (text/event-stream). Browsers reconnect automatically when the connection drops. It works well for dashboards, notifications and live feeds.
Multi-platform images: linux/amd64, linux/arm64, linux/arm/v7, linux/arm/v6.
Quick start
Pull the image:
docker pull aeciopires/go-sse:latest
Run it:
docker run -d --name go-sse -p 8080:8080 aeciopires/go-sse:latest
Open http://localhost:8080 in your browser to watch the event stream live.
Or consume the stream from the terminal:
curl -N http://localhost:8080/sse
Example output:
retry: 3000
id: 1
event: welcome
data: {"message":"Connected to go-sse Server-Sent Events","client_id":"019a...","interval_ms":2000,"timestamp":"2026-11-16T12:00:00Z"}

id: 2
event: update
data: {"message":"Server update #1","timestamp":"2026-11-16T12:00:02Z","server_time":1794830402,"cpu_usage":26,"memory_usage":41,"connections":1,"event_id":2,"client_id":"019a..."}
cpu_usage and memory_usage are simulated values for demo purposes.
Stop and remove the container:
docker rm -f go-sse
Configuration
Everything is configured with environment variables:
| Variable | Default | Description |
|---|---|---|
PORT | 8080 | HTTP port |
LOG_LEVEL | INFO | DEBUG, INFO, WARN or ERROR |
SSE_EVENT_INTERVAL | 2s | Interval between update events (Go duration) |
SHUTDOWN_DELAY | 0s | Time to keep serving after readiness turns false (lets load balancers drain) |
SHUTDOWN_TIMEOUT | 15s | Maximum time for graceful shutdown |
OTEL_SERVICE_NAME | go-sse | Service name in logs, traces and metrics |
OTEL_EXPORTER_OTLP_ENDPOINT | (unset) | When set, traces and logs are exported via OTLP/HTTP |
OTEL_SDK_DISABLED | (unset) | true turns OTLP export off |
Example: faster events, debug logs and export to an OpenTelemetry Collector:
docker run -d --name go-sse -p 8080:8080 \
  -e LOG_LEVEL=DEBUG \
  -e SSE_EVENT_INTERVAL=500ms \
  -e OTEL_EXPORTER_OTLP_ENDPOINT=http://otel-collector:4318 \
  aeciopires/go-sse:latest
Full reference: https://github.com/aeciopires/go-sse/blob/main/docs/05-configuration.md
Endpoints
| Endpoint | Method | Description |
|---|---|---|
/ | GET | Web interface |
/sse | GET | SSE stream (welcome + update every SSE_EVENT_INTERVAL) |
/health | GET | Status: version, uptime and active connections |
/livez | GET | Liveness probe |
/readyz | GET | Readiness probe (returns 503 while starting or shutting down) |
/metrics | GET | Prometheus/OpenMetrics metrics |
/static/* | GET | Static assets |
Features
- SSE protocol compliance:
Content-Type: text/event-stream,Cache-Control: no-cache, flush after every event,retry:hint andLast-Event-IDresume after reconnection (event IDs keep going from where they stopped). - Web UI in Material Design 3 with dark (default) and light themes.
- Prometheus metrics with exemplars that link metrics to traces:
sse_http_requests_total,sse_http_request_duration_secondssse_active_connections,sse_events_sent_totalsse_event_duration_seconds,sse_session_duration_secondssse_build_info, plus Go runtime and process metrics
- Structured JSON logs with configurable level and
trace_id/span_idcorrelation, ready for Loki. - OpenTelemetry traces and logs over OTLP/HTTP (works with the OTel Collector, Tempo, Jaeger and Loki).
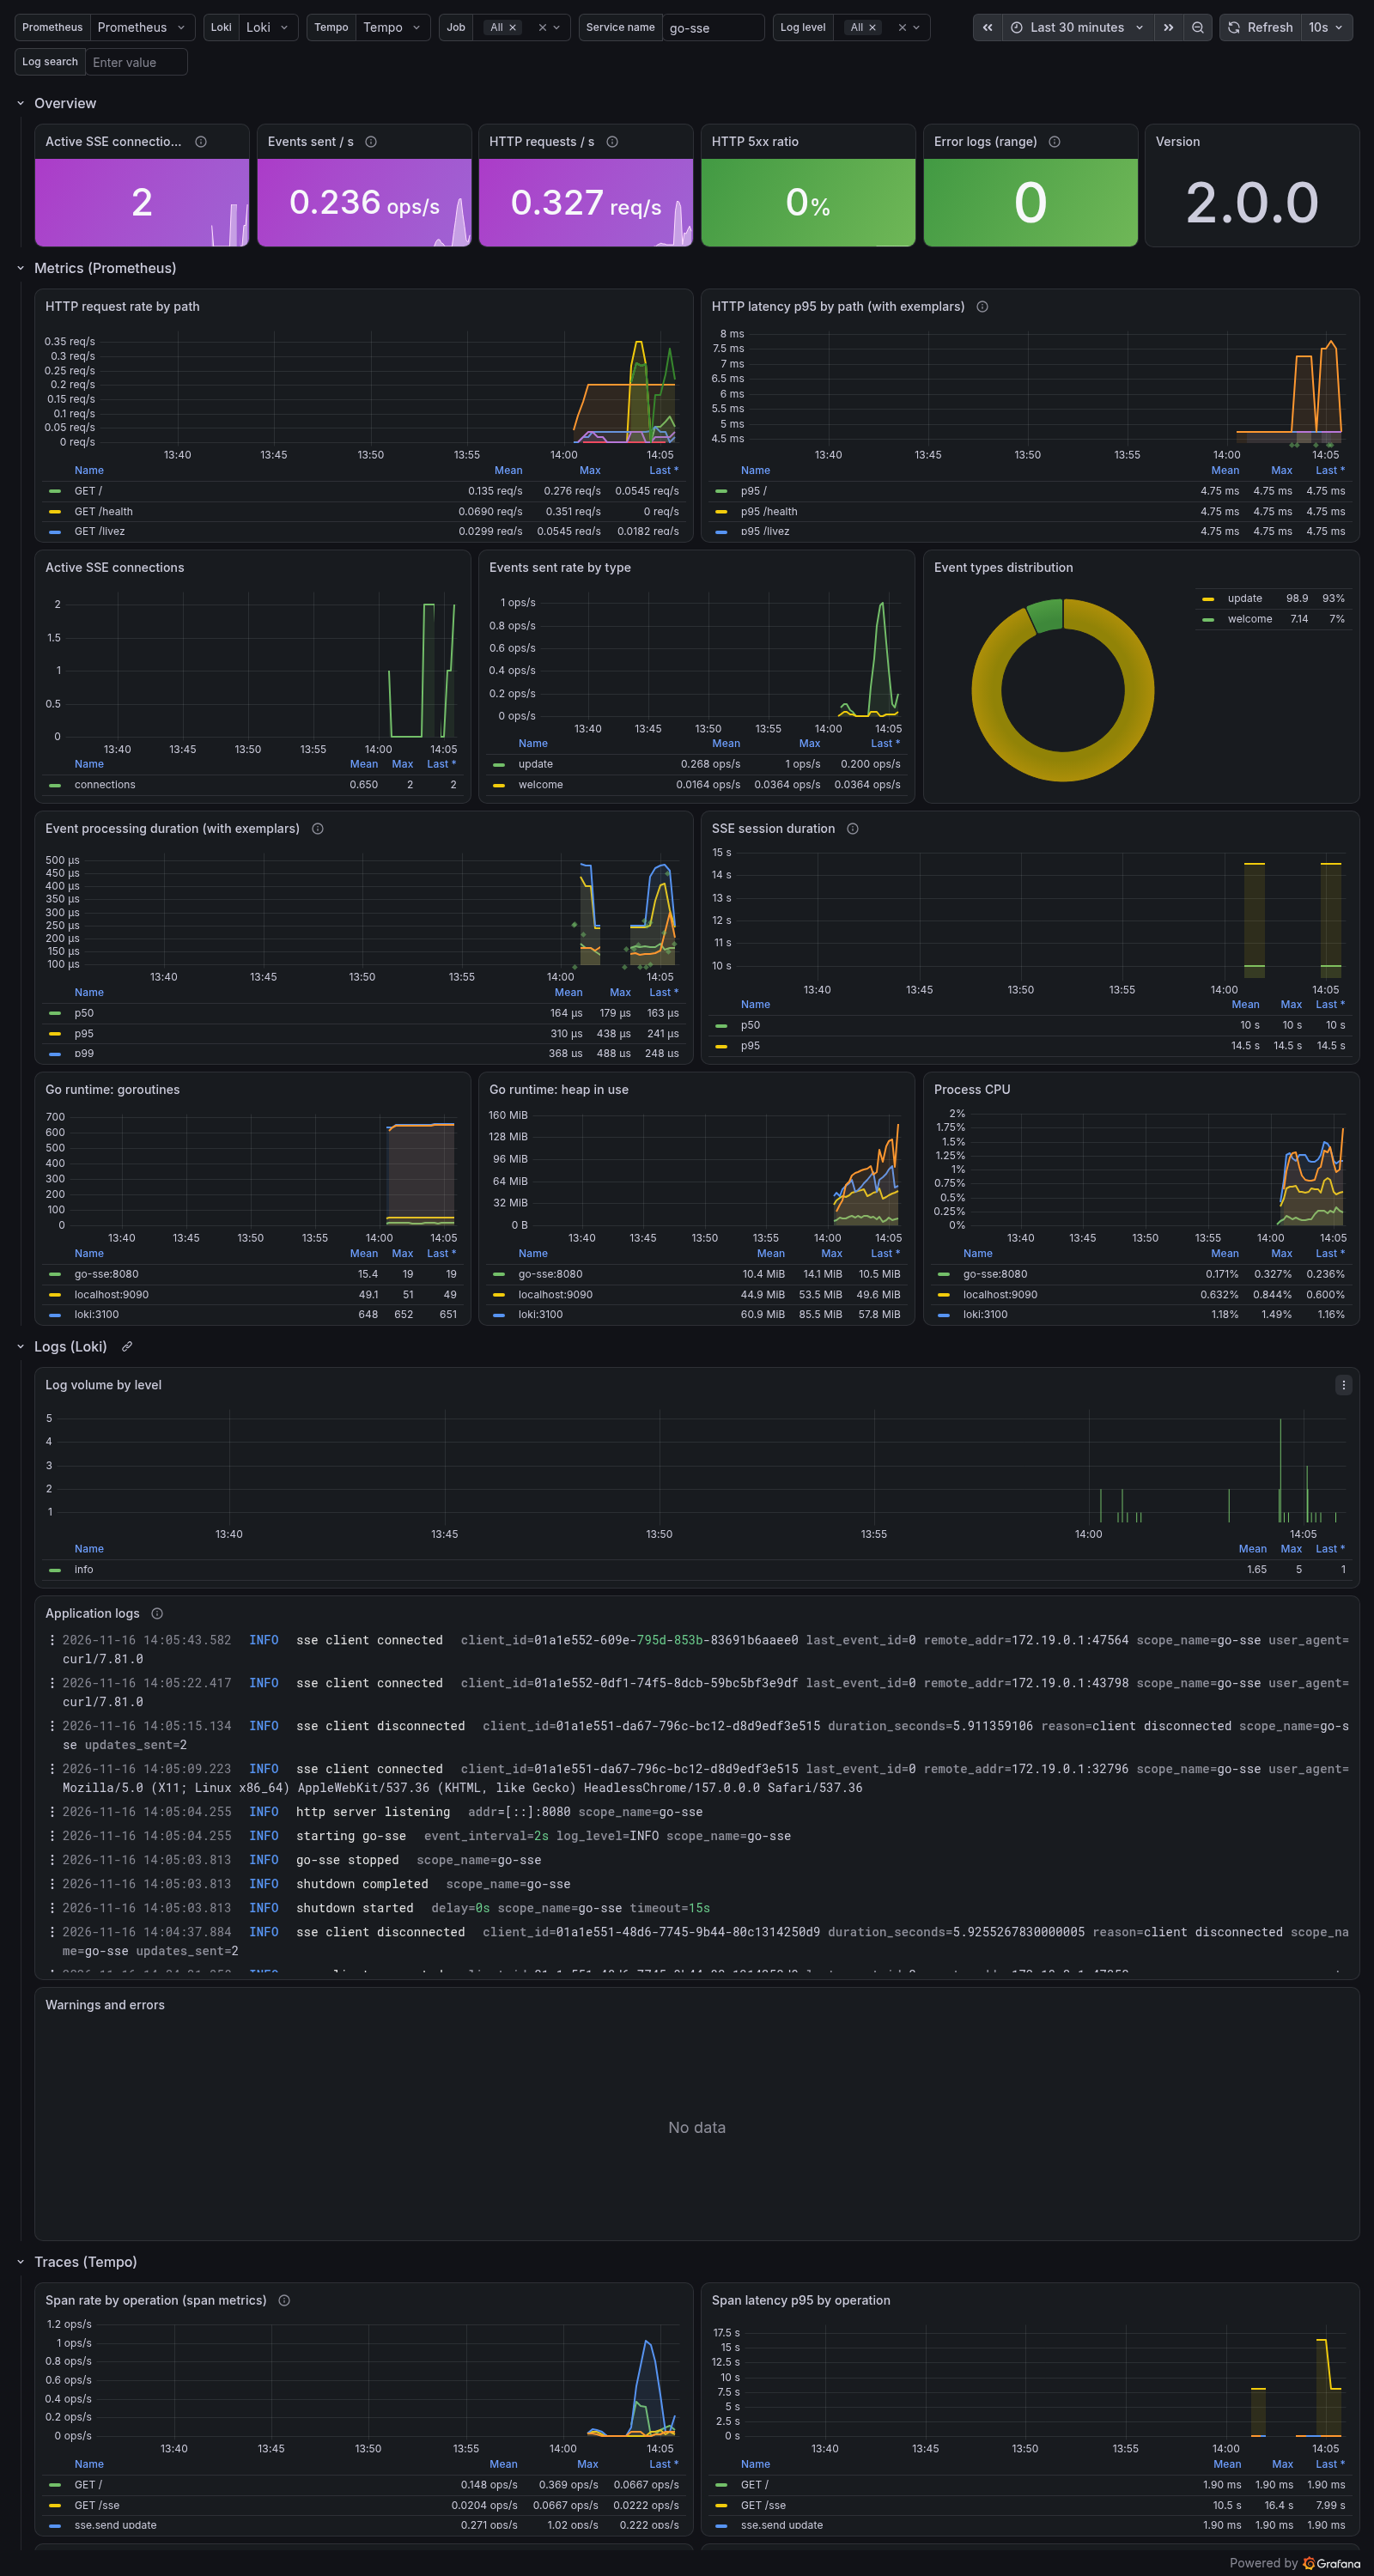
- Ready-made Grafana dashboard covering metrics, logs and traces.
- Kubernetes-ready: liveness/readiness probes and graceful shutdown that also closes open SSE streams.
- Security: runs as a non-root user (UID
10001), static stripped binary on Alpine, works with a read-only root filesystem, security headers (CSP), scanned with Trivy. - Built-in Docker
HEALTHCHECK(the binary checks itself, so the image needs nocurlorwget).
Full observability stack with Docker Compose
The repository includes a Docker Compose stack that starts go-sse with the OpenTelemetry Collector, Prometheus, Loki, Tempo, Jaeger and Grafana, all connected and provisioned:
git clone https://github.com/aeciopires/go-sse.git
cd go-sse/app
make compose-up
| Service | URL |
|---|---|
| go-sse | http://localhost:8080 |
| Grafana (admin / admin) | http://localhost:3000 → Dashboards → go-sse |
| Prometheus | http://localhost:9090 |
| Jaeger | http://localhost:16686 |
Kubernetes
Deploy with the Helm 4 chart in the repository. It includes a hardened security context, probes, HPA, PodDisruptionBudget, ServiceMonitor and the Grafana dashboard as a ConfigMap:
https://github.com/aeciopires/go-sse/tree/main/helm-chart
Useful flags
docker run --rm aeciopires/go-sse:latest -version          # print the version
docker exec go-sse /app/go-sse -healthcheck               # probe /livez of a running container
docker inspect --format '{{.State.Health.Status}}' go-sse # health status reported by Docker
Contributing
Issues and pull requests are welcome at https://github.com/aeciopires/go-sse. See CONTRIBUTING.md.
Maintainer
Aécio Pires — https://linktr.ee/aeciopires
Tag summary
Content type
Image
Digest
sha256:ee068ab59…
Size
10.1 MB
Last updated
3 days ago
docker pull aeciopires/go-sse