imatefx/typesense-prometheus-exporter
Prometheus exporter for Typesense: metrics, stats, health and raft state, with Grafana dashboards
50K+
imatefx/typesense-prometheus-exporter repository overview
Typesense Prometheus Exporter
Prometheus metrics, Grafana dashboards and alerts for Typesense: single nodes and HA clusters.







Documentation · Getting started · Configuration · Metrics · Kubernetes · Migrating to 1.0 · Architecture · Changelog
Important
**Upgrading from 0.4.x? 1.0.0 renames the metrics.** The new 1.0 names are the default, so dashboards and queries built on `typesense_metrics{key=…}` or `typesense_stats{key=…}` need updating. Set `TYPESENSE_METRIC_NAMES=both` to keep the old names alongside the new ones while you migrate. See [migrating to 1.0](https://github.com/imatefx/typesense-prometheus-exporter/blob/main/docs/migrating-to-1.0.md).
Features
| 🩺 Health and cluster state | typesense_health and typesense_raft_state per node. Alert on an unhealthy node, or on a cluster that has lost its leader. |
| 📊 System and memory | CPU for every core, disk, memory, swap, network, and Typesense's allocator memory. |
| ⚡ Request stats | Requests per second, and latency in seconds for search, write, import and delete: average, p70, p95, p99, min and max. Broken down per endpoint and per collection, plus cache hits and misses and pending write batches. |
| 🔁 Replication and collections | Raft committed index and queued writes per node, so you can see replication lag. Document count per collection. Typesense version per node. |
| 🎯 Honest failures | If Typesense can't be reached, its metrics are left out, never faked as zeros. A per-request timeout keeps a hung node from stalling scrapes. |
| 📦 Tiny image | A static binary in a FROM scratch image, for linux/amd64 and linux/arm64. |
| 🧰 Batteries included | 4 Grafana dashboards, Prometheus alert rules, and a one-command Docker Compose cluster for trying it all out. |
Quick start
See it working in one command. This starts a 3-node Typesense cluster, one exporter probing all three, and Prometheus and Grafana:
docker compose up -d --build
./scripts/traffic.sh 300          # optional: generate traffic
open http://localhost:3000        # Grafana: admin / admin
Monitor your own Typesense. Run an exporter next to a node:
docker run -d -p 8888:8888 \
  -e TYPESENSE_HOST=typesense-1.internal \
  -e TYPESENSE_API_KEY=<admin-api-key> \
  imatefx/typesense-prometheus-exporter:v1.4.0

curl -s localhost:8888/metrics | grep -E '^typesense_(health|raft_state)'
Then scrape it from Prometheus. The exporter serves /metrics, the Prometheus default, so a single node needs only its address:
scrape_configs:
  - job_name: typesense-exporter
    scrape_timeout: 10s   # must be above TYPESENSE_TIMEOUT (5s by default)
    static_configs:
      - targets: [exporter-1.internal:8888]
For a cluster with one exporter next to each node, list every exporter:
scrape_configs:
  - job_name: typesense-exporter
    scrape_timeout: 10s
    static_configs:
      - targets:
          - exporter-1.internal:8888   # exporter for typesense-1
          - exporter-2.internal:8888   # exporter for typesense-2
          - exporter-3.internal:8888   # exporter for typesense-3
One exporter for a whole cluster. Leave out TYPESENSE_HOST, list the nodes the exporter may probe, and let Prometheus pass each node as a target, like blackbox_exporter:
docker run -d -p 8888:8888 \
  -e TYPESENSE_PROBE_ALLOWED_TARGETS=ts-1.internal,ts-2.internal,ts-3.internal \
  -e TYPESENSE_API_KEY=<admin-api-key> \
  imatefx/typesense-prometheus-exporter:v1.4.0

curl -s 'localhost:8888/probe?target=ts-1.internal' | grep -E '^typesense_(health|raft_state)'
Prometheus scrapes the exporter once per node and passes the node as target. Spelled out, each node is one entry: the address is the exporter, __param_target becomes ?target=, and instance names the node:
scrape_configs:
  - job_name: typesense-exporter
    metrics_path: /probe
    static_configs:
      - targets: [exporter.internal:8888]   # the exporter
        labels: {__param_target: ts-1.internal:8108, instance: ts-1.internal:8108}
      - targets: [exporter.internal:8888]
        labels: {__param_target: ts-2.internal:8108, instance: ts-2.internal:8108}
      - targets: [exporter.internal:8888]
        labels: {__param_target: ts-3.internal:8108, instance: ts-3.internal:8108}
The same scrape config, shorter as the cluster grows: list only the nodes, and let relabeling fill in the rest. This is the usual blackbox_exporter pattern, and it also works with service discovery instead of static_configs:
scrape_configs:
  - job_name: typesense-exporter
    metrics_path: /probe
    static_configs:
      - targets: [ts-1.internal:8108, ts-2.internal:8108, ts-3.internal:8108]
    relabel_configs:
      - source_labels: [__address__]    # the node...
        target_label: __param_target    # ...becomes ?target=<node>
      - source_labels: [__param_target]
        target_label: instance          # instance names the node, not the exporter
      - target_label: __address__
        replacement: exporter.internal:8888   # every scrape goes to the exporter
Several clusters with different keys. Put everything in one TOML file, with a [clusters.<name>] per cluster (targets, api_key_file or api_key_env, optional protocol), and start with typesense-prometheus-exporter --config exporter.toml. /probe uses a cluster's key only for that cluster's nodes. See the config file, several clusters and deploy/exporter.example.toml.
The exporter only probes the listed nodes, because it sends its API key to every node it scrapes. See configuration.
On Kubernetes, deploy/kubernetes/ has plain manifests (with a Prometheus Operator ServiceMonitor or Probe) for both setups, and a key file such as a mounted Secret is reloaded without a restart.
The exporter's own health. GET /exporter/metrics serves counters for scrapes (including refused /probe targets), Typesense request outcomes and durations, probe slot waits and API key reloads, apart from any node's output. Scrape it as its own job (metrics_path: /exporter/metrics, no /probe); see exporter metrics and the job in deploy/prometheus/prometheus.yml.
Then import the dashboards and alert rules. The getting started guide walks through it.
Configuration
| Flag | Environment variable | Default |
|---|---|---|
--config | TYPESENSE_EXPORTER_CONFIG | (none): TOML file that can set every option below and define per-cluster API keys; see configuration |
--typesense-host | TYPESENSE_HOST | (required unless --probe-allowed-targets or config clusters are set) |
--typesense-api-key / --typesense-api-key-file | TYPESENSE_API_KEY / TYPESENSE_API_KEY_FILE | (one is required) |
--typesense-port | TYPESENSE_PORT | 8108 |
--typesense-protocol | TYPESENSE_PROTOCOL | http |
--typesense-timeout | TYPESENSE_TIMEOUT | 5 seconds (0 disables); keep it below Prometheus' scrape_timeout |
--exporter-bind-address | EXPORTER_BIND_ADDRESS | 0.0.0.0 |
--exporter-bind-port | EXPORTER_BIND_PORT | 8888 |
--metric-names | TYPESENSE_METRIC_NAMES | v1 (both or legacy keep the 0.4 names; see migrating) |
--probe-allowed-targets | TYPESENSE_PROBE_ALLOWED_TARGETS | (empty): comma-separated host[:port] nodes /probe?target= may scrape, or * for any |
--probe-max-concurrency | TYPESENSE_PROBE_MAX_CONCURRENCY | 16: most /probe scrapes running at once; more wait for a slot |
--log-level | TYPESENSE_EXPORTER_LOG_LEVEL | info (error, warn, info, debug, trace); debug logs every Typesense request, and RUST_LOG overrides it; see logging |
--log-format | TYPESENSE_EXPORTER_LOG_FORMAT | text (or json, one object per line) |
See configuration for API key permissions, timeouts, failure behaviour, Prometheus and Grafana setup.
Metrics at a glance
| Metric | What it tells you |
|---|---|
typesense_health | 1 healthy, 0 unhealthy or unreachable |
typesense_raft_state | 1 leader, 4 follower, 0 other or unreachable |
typesense_raft_committed_index | Raft log position; compare across nodes for replication lag |
typesense_raft_queued_writes | Writes waiting to be applied |
typesense_collection_documents{collection=…} | Documents per collection |
typesense_info{version=…} | Typesense version of each node |
typesense_scrape_success{endpoint=…} | Whether each Typesense endpoint could be read, for spotting key or version problems |
typesense_system_* | CPU (…_cpu_active_ratio, per core …_cpu_core_active_ratio{core}), memory, swap and disk in bytes, network byte counters (…_bytes_total) |
typesense_process_memory_* | Typesense's allocator memory in bytes, and its fragmentation ratio |
typesense_requests_per_second{operation=…} | Requests per second for search, import, write and delete; plus typesense_all_requests_per_second and typesense_overloaded_requests_per_second |
typesense_request_latency_seconds{operation=…,quantile=…} | Latency min (0), p70, p95, p99 and max (1); the average is typesense_request_latency_avg_seconds |
typesense_cache_hit_ratio, typesense_cache_hits, typesense_cache_misses | Search cache; plus typesense_pending_write_batches |
typesense_route_{latency_seconds,requests_per_second}{route=…}, typesense_collection_{latency_seconds,requests_per_second}{collection=…,action=…} | Requests per second and latency per API route, and per collection and action |
typesense_unmapped{source=…,key=…} | Numeric Typesense fields the exporter has no name for yet (raw values) |
See the metrics reference for every family, with units and example PromQL. These are the 1.0 names, the default since 1.0.0; the 0.4 names map over as shown in the migration guide.
Alerts
| Alert | Fires when |
|---|---|
TypesenseExporterDown | Prometheus can't scrape an exporter (or, with /probe, a probe through it) for 1m |
TypesenseUnhealthy | A node is unhealthy or unreachable for 1m |
TypesenseNoLeader | No node is raft leader for 1m. A normal election (a few seconds) doesn't trigger it. |
TypesenseScrapeFailing | A healthy node has an endpoint the exporter can't read for 5m (API key permissions, older Typesense) |
TypesenseExporterKeyReloadFailing | A rotated API key file can't be read for 5m; the exporter still uses the previous key |
TypesenseExporterProbeRefused | /probe refused a target (403) in the last 10m: something probes nodes that aren't allowed. Malformed requests (400) are counted but don't alert |
TypesenseExporterProbesSaturated | Probes wait over 1s (p95) for a --probe-max-concurrency slot for 10m |
TypesenseExporterSelfMetricsDown | The typesense-exporter-self job can't be scraped for 5m; the three alerts above are silent meanwhile |
The last four need the exporter's own metrics, from the /exporter/metrics scrape job.
Dashboards
Four dashboards, each with a Node filter. They're also on grafana.com, so you can import them by ID (Dashboards → New → Import, enter the ID, pick your Prometheus data source):
| Dashboard | grafana.com ID |
|---|---|
| Typesense Cluster Overview | 26064 |
| Typesense Stats | 26065 |
| Typesense Metrics | 26066 |
| Typesense By Collection | 26067 |
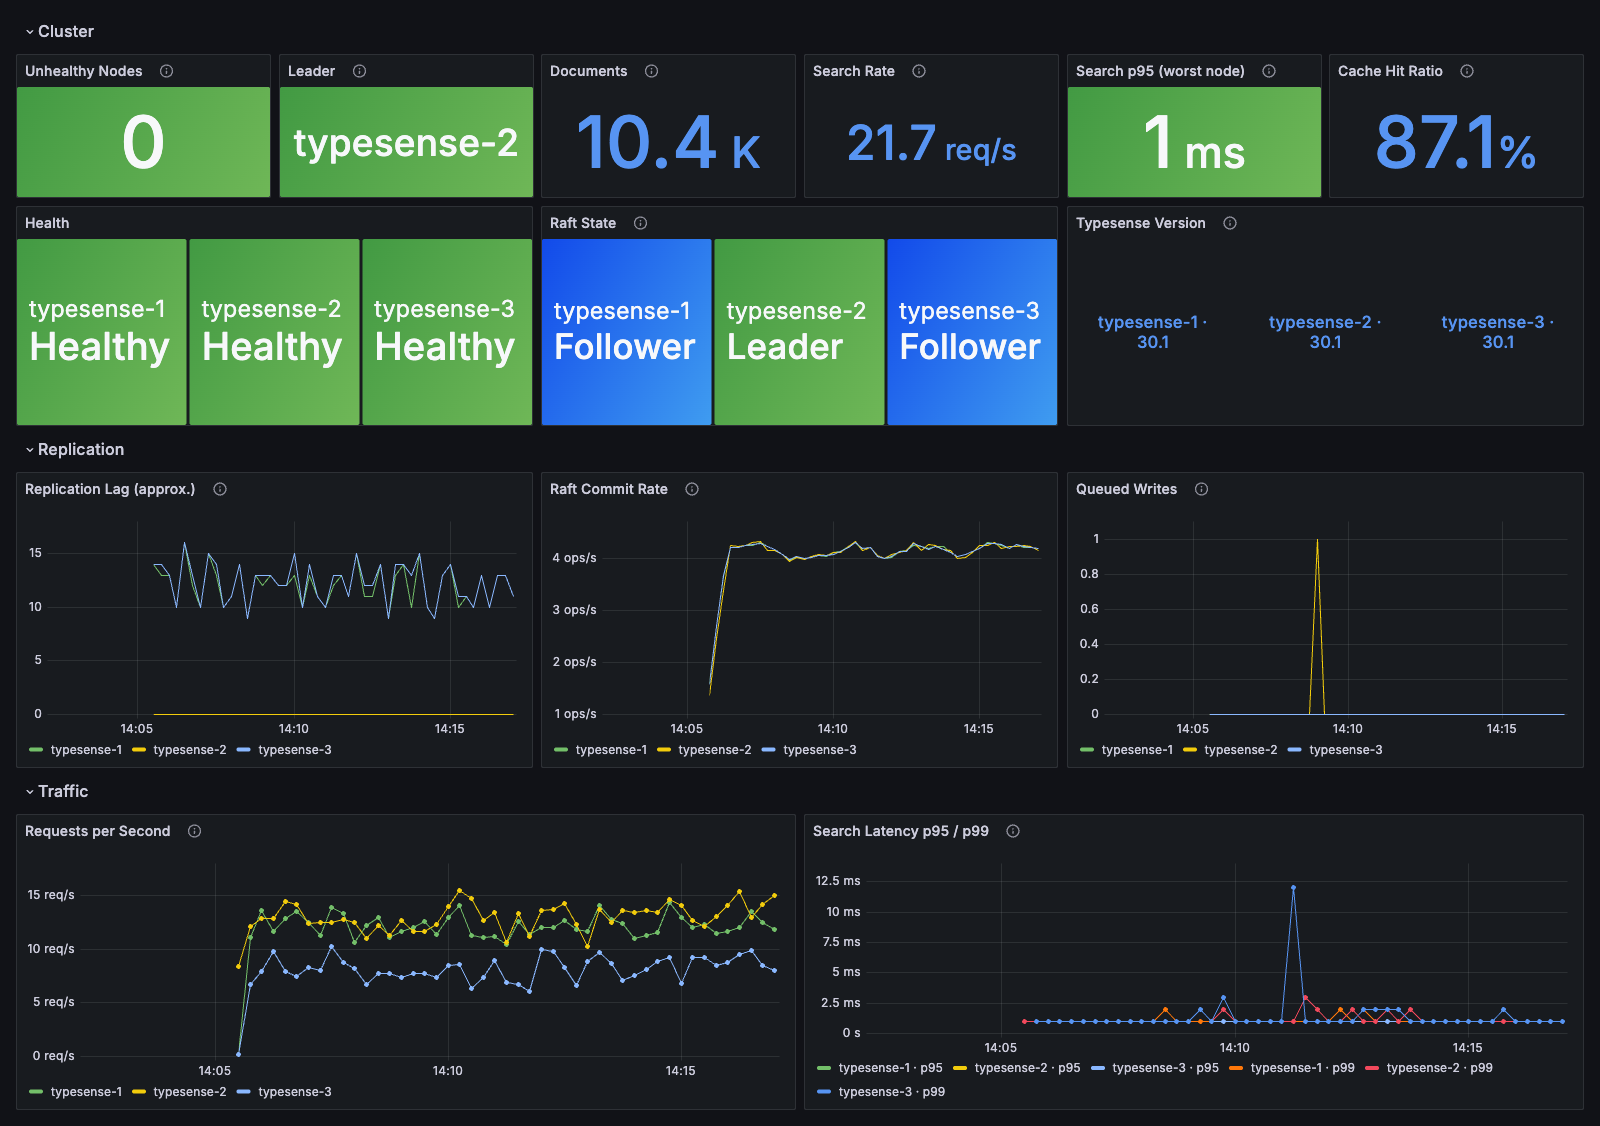
Typesense Cluster Overview: health, leader, versions, replication lag, documents, headline traffic
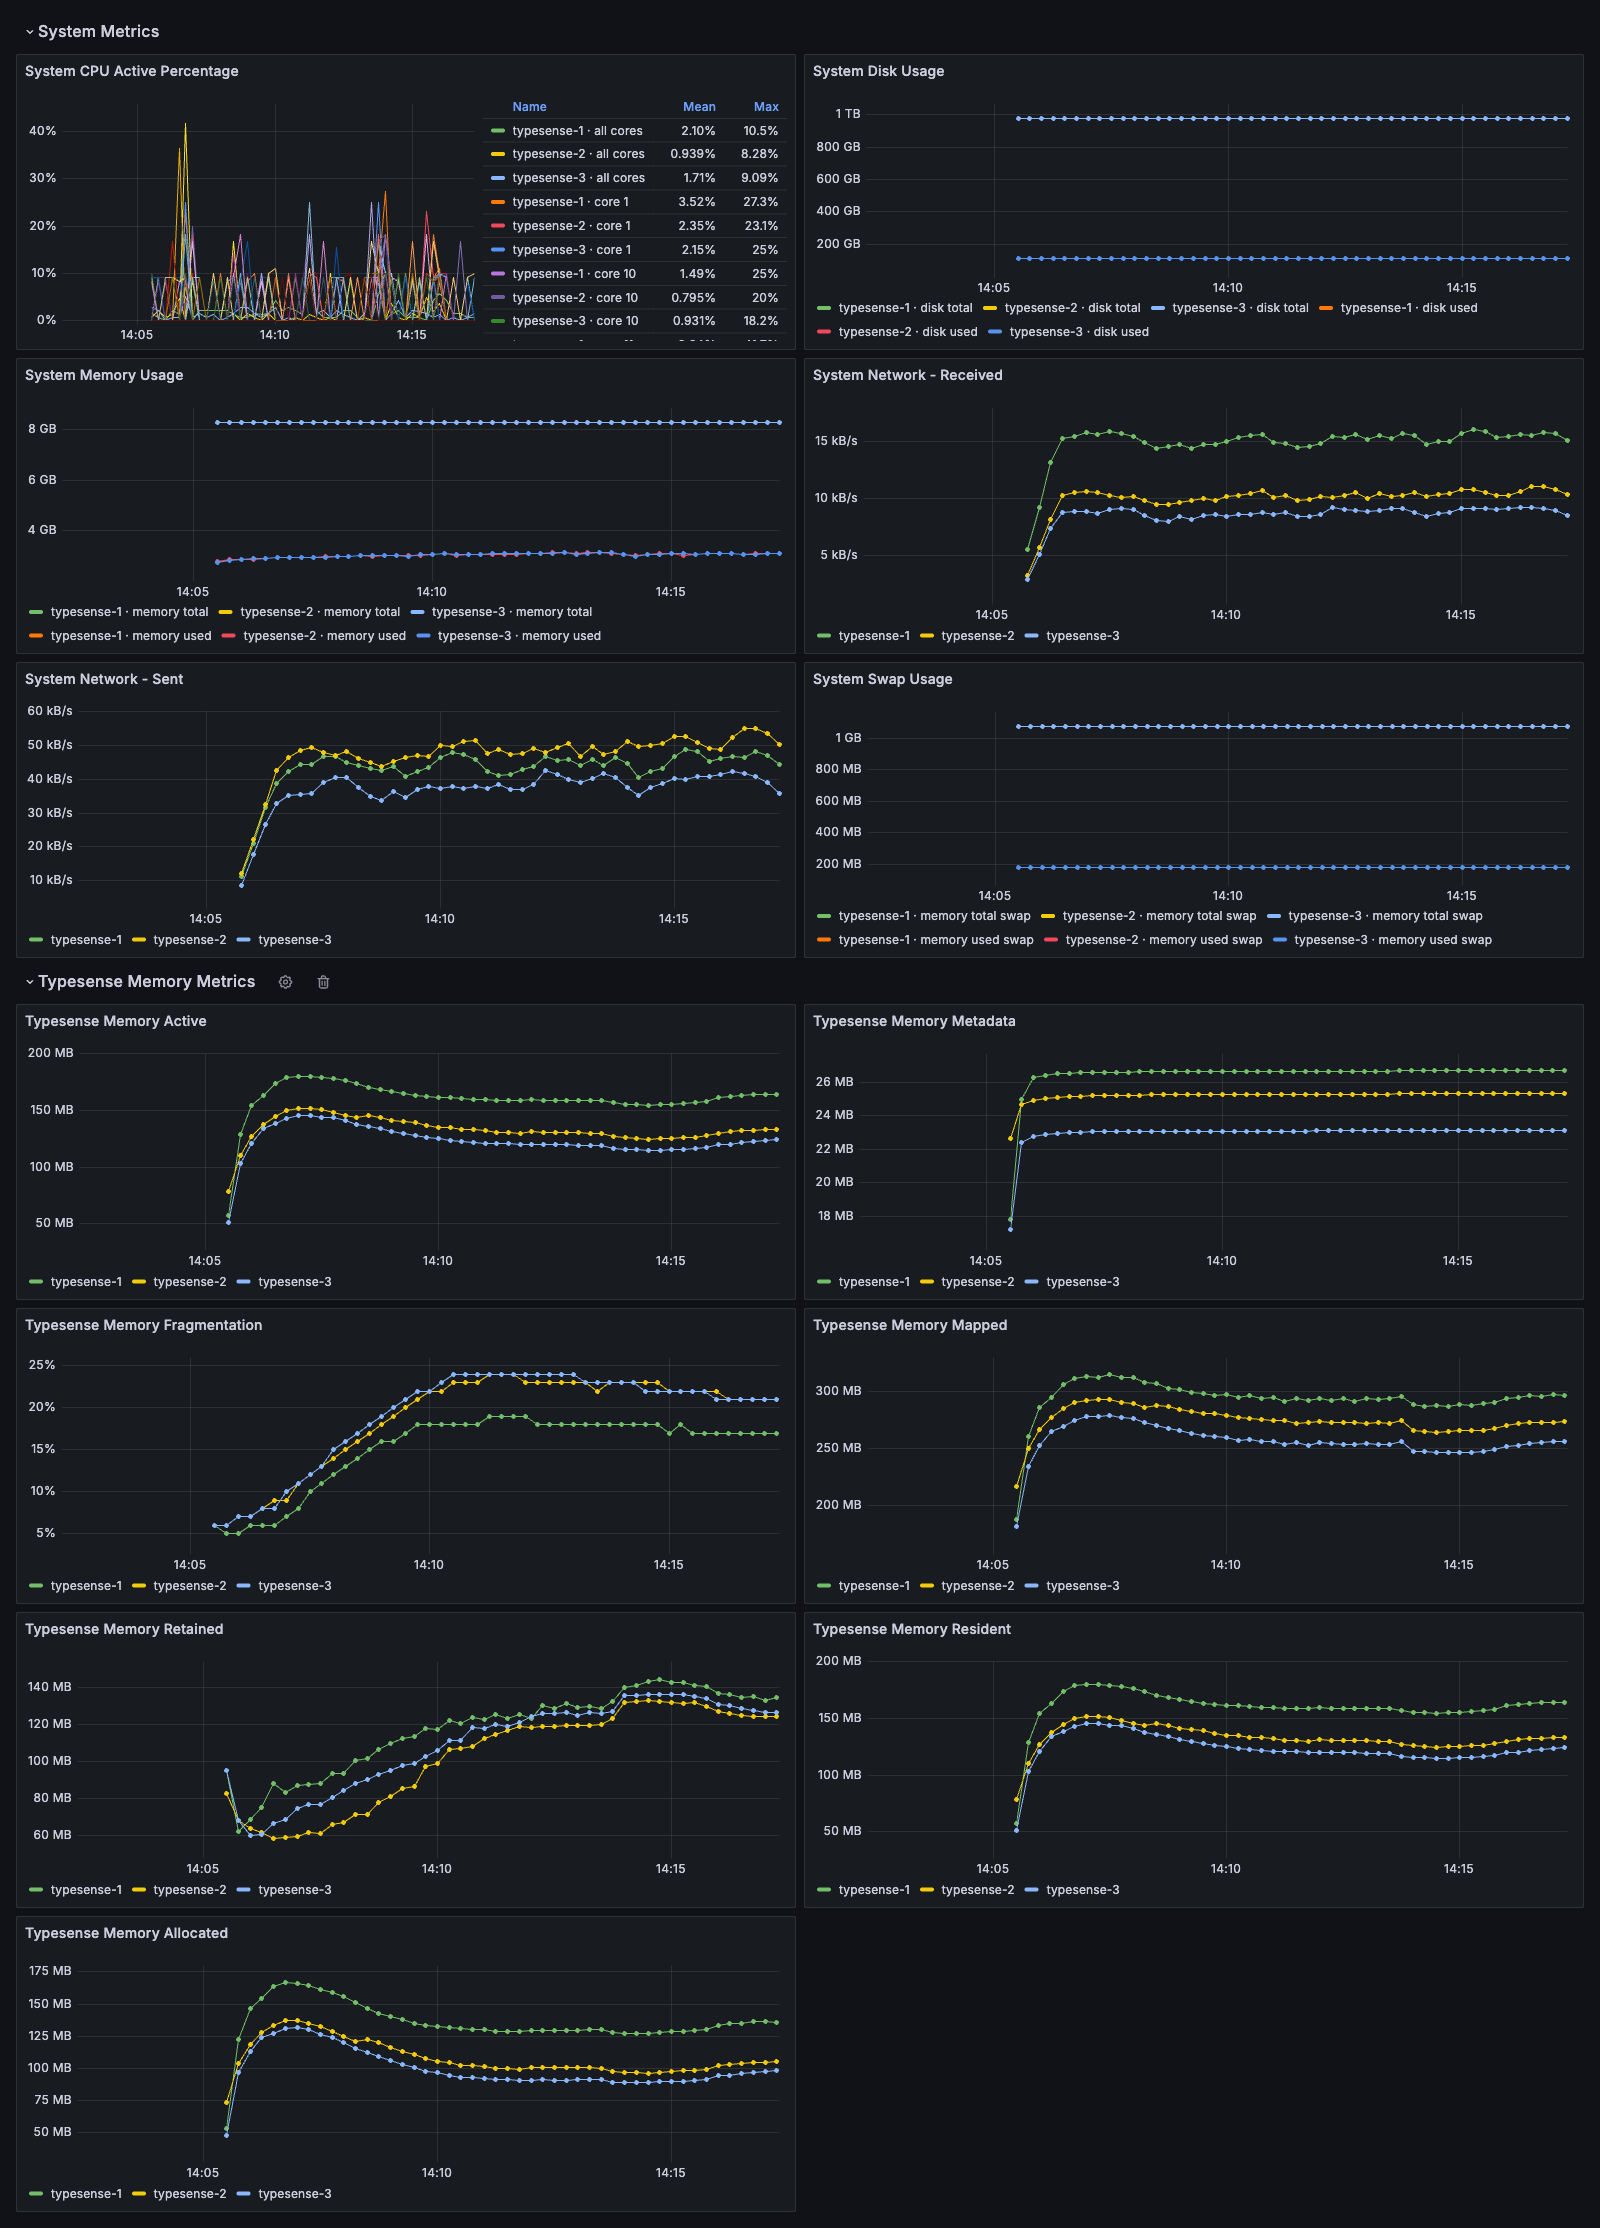
Typesense Metrics: CPU per core, disk, memory, swap, network, allocator memory
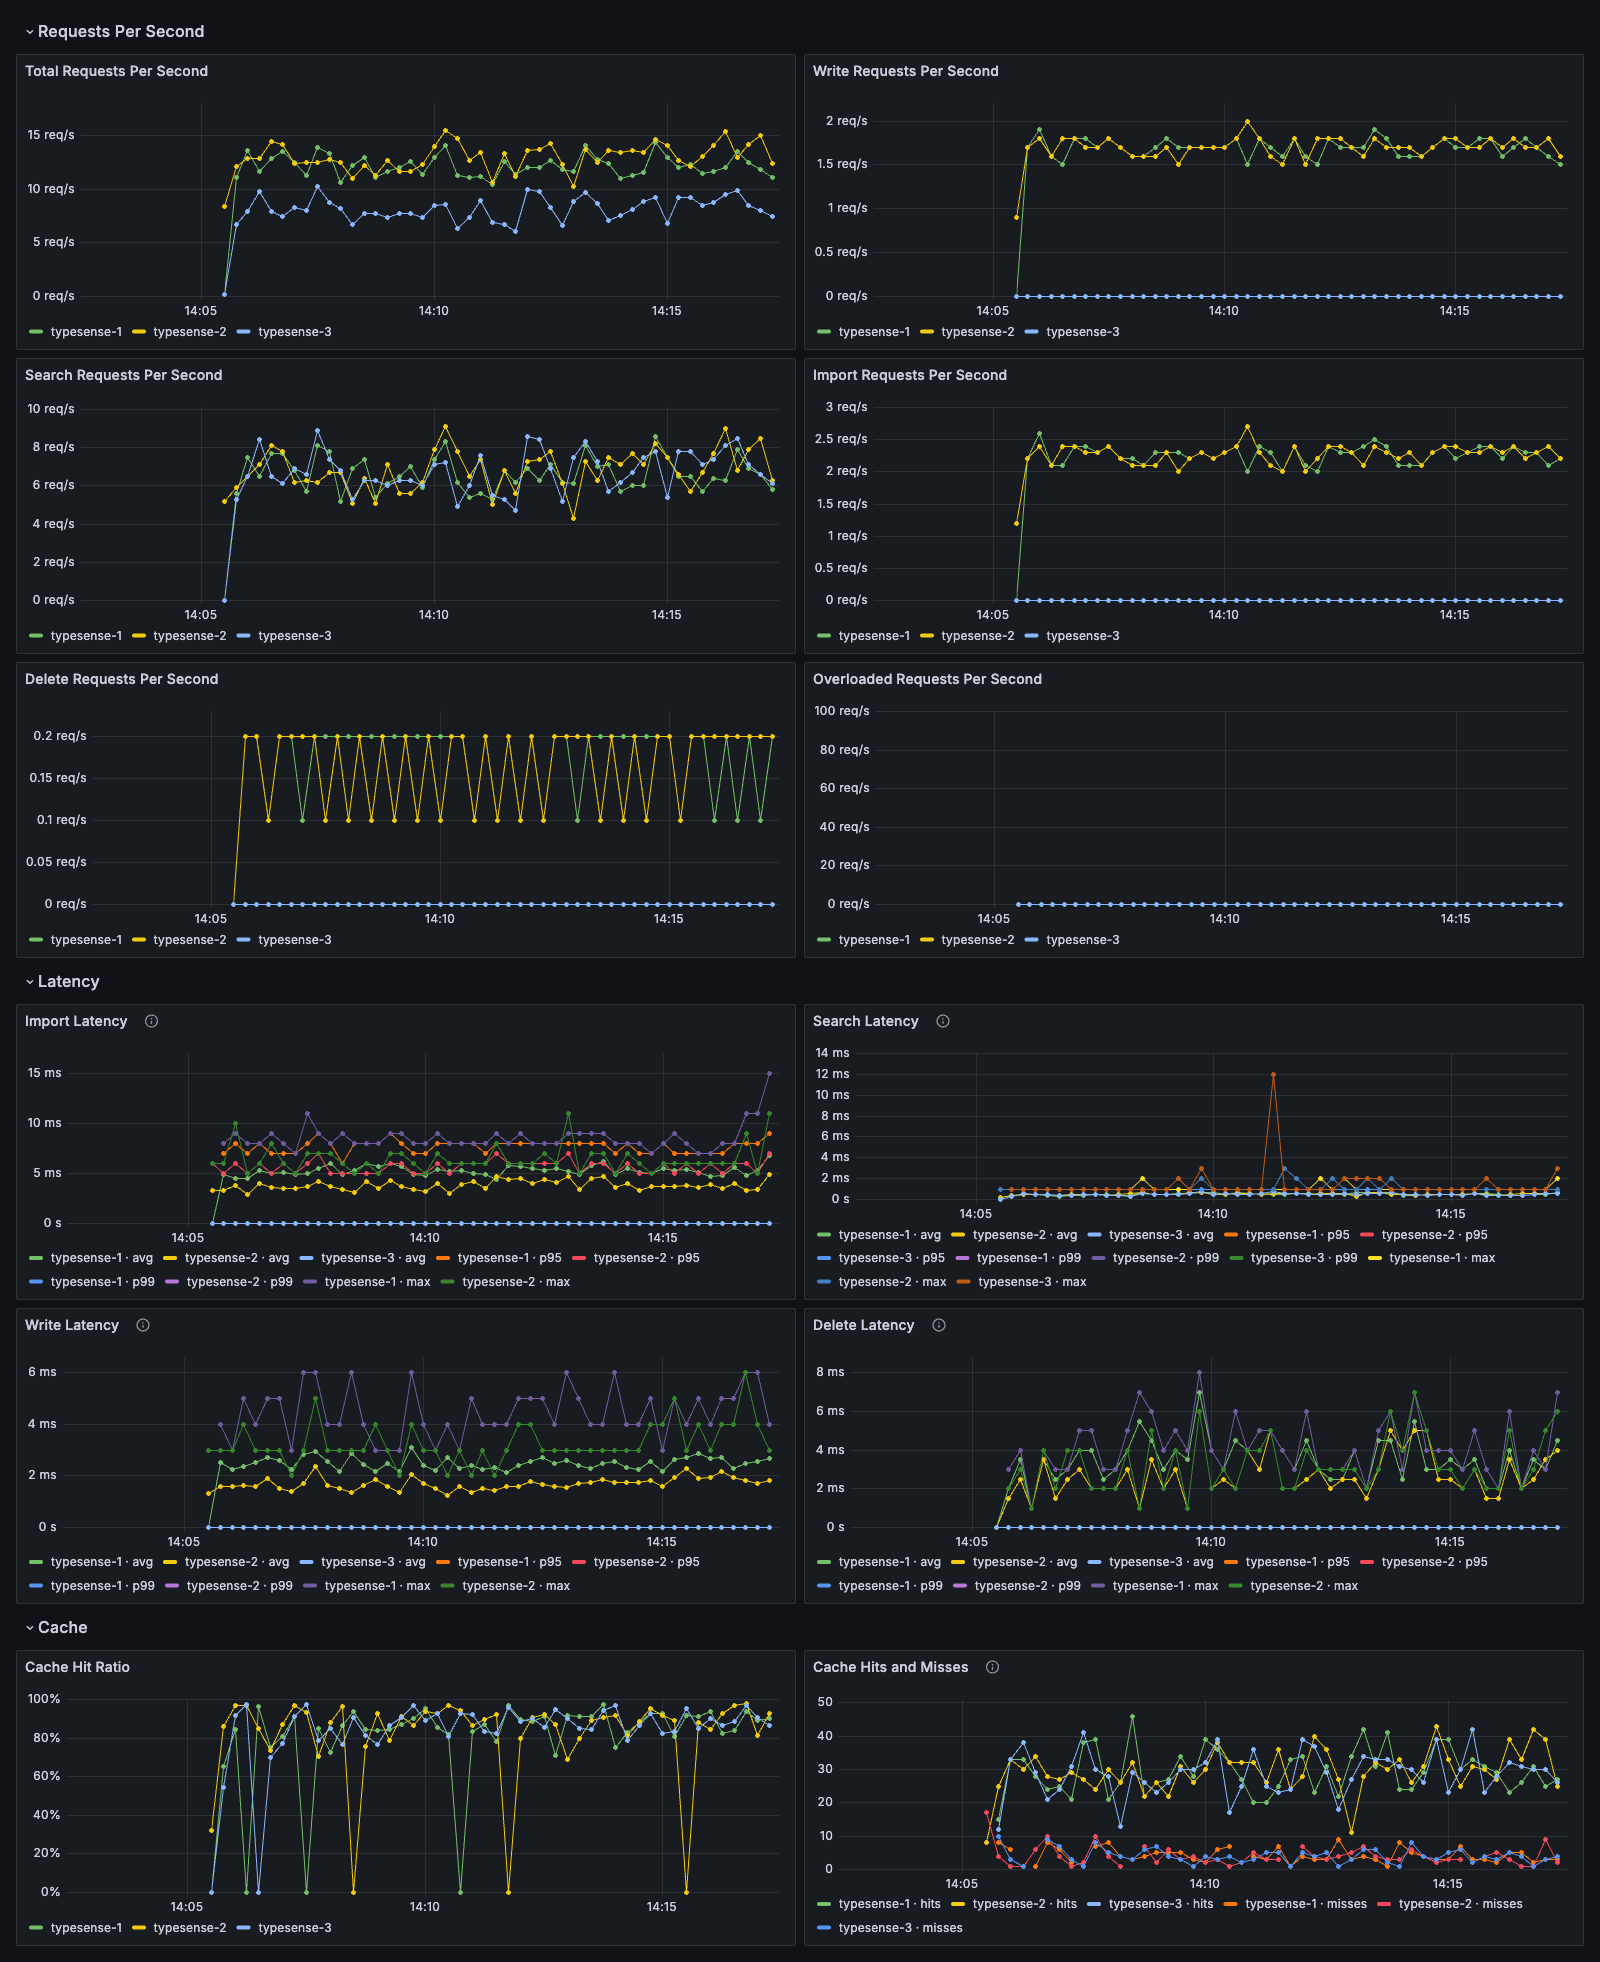
Typesense Stats: request rates, latency avg/p95/p99/max, cache
Typesense By Collection: per-collection request rate, latency and documents
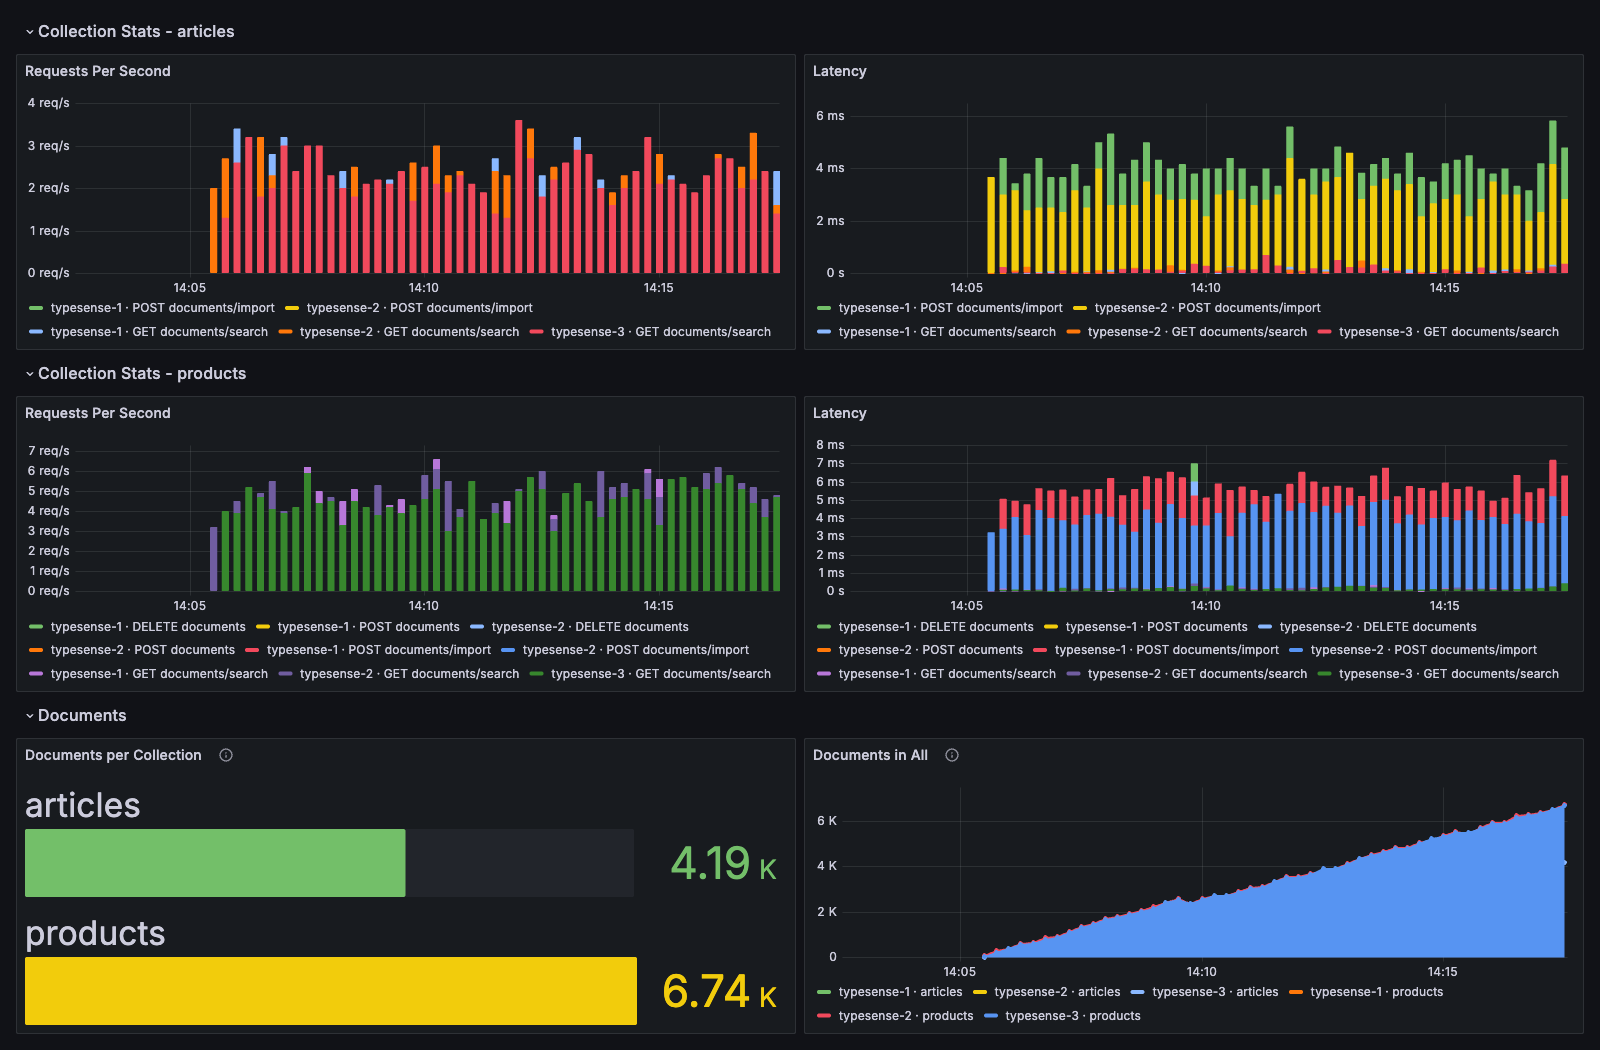
The screenshots were taken from the bundled Docker Compose stack: 3 nodes under generated traffic.
Development
make test         # lint + unit + integration tests
make coverage     # coverage report (fails under 90%)
make e2e          # end-to-end tests against a real 3-node cluster (needs Docker)
make up / down    # start / stop the Docker Compose stack
./build-cross.sh  # static linux/amd64 + linux/arm64 binaries
There are 207 tests in three layers. Unit and integration tests run against a mock Typesense. End-to-end tests run against a real cluster and break it on purpose: leader failover, a hung node, quorum loss. They run against Typesense 30.1 and 27.1 (TYPESENSE_VERSION=27.1 make e2e). See testing for the full list.
Contributors
Thanks to everyone who has contributed:
 Stalin Pereira Creator and maintainer |  Leandro Stats protocol fix (#4) |  Andrii Maryskevych Multi-arch Docker (#10), health and raft (#13) |
 weriomat Optional CPU metrics (#11) |  Sebastian Caldarola Multi-host proposal (#14) |  cyppe Per-core CPU, swap, cache ratio (#15) |
License
MIT © Stalin Pereira
Tag summary
Content type
Image
Digest
sha256:68782973b…
Size
3.9 MB
Last updated
3 days ago
docker pull imatefx/typesense-prometheus-exporter